Blog post -
Is Southeast Asia Safe? Where are the Safest Places, and Why.
When you search Google for the keywords “Southeast Asia” and “safety,” the top results point to articles about travel and safety that do not spark enthusiasm for travel in this region. They highlight the dangers, as well as the incidence of traffic accidents, food poisoning, and drowning. So if travelers are unsafe, what about the 620 million people who live in this region? What does “being safe” mean? Where are some people safer than others, and why are they are safer there? And does being safe equate to better quality of life and overall well-being?
What is Safety?
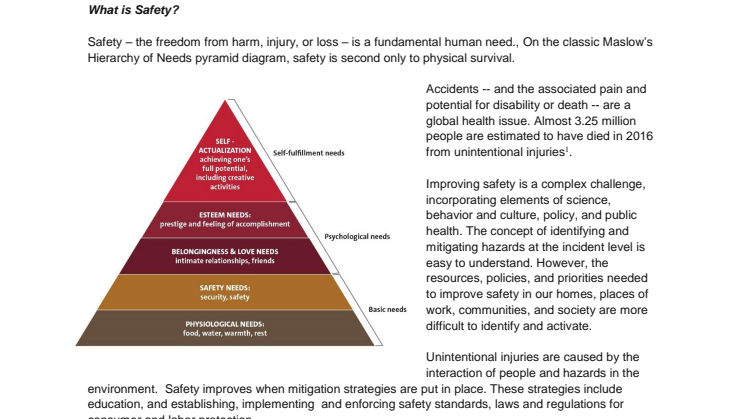
Safety – the freedom from harm, injury, or loss – is a fundamental human need., On the classic Maslow’s Hierarchy of Needs pyramid diagram, safety is second only to physical survival.
 Figure 1: Maslow's Hierarchy of Needs
Accidents -- and the associated pain and potential for disability or death -- are a global health issue. Almost 3.25 million people are estimated to have died in 2016 from unintentional injuries[1].
Improving safety is a complex challenge, incorporating elements of science, behavior and culture, policy, and public health. The concept of identifying and mitigating hazards at the incident level is easy to understand. However, the resources, policies, and priorities needed to improve safety in our homes, places of work, communities, and society are more difficult to identify and activate.
Unintentional injuries are caused by the interaction of people and hazards in the environment.Safety improves when mitigation strategies are put in place. These strategies include education, and establishing, implementing and enforcing safety standards, laws and regulations for consumer and labor protection.
At UL, we have a comprehensive view of the concept of safety. We believe that the interaction between people and hazards, amplified or mitigated by resources, infrastructure, behavior, safety frameworks, and culture enables a safe environment. Socio-economic factors, policies, and programs established as systems (not in isolation) are crucial elements that create better safety outcomes.
 Figure 2: UL Conceptual Model of Safety
The UL Safety IndexTM
The UL Safety Index quantifies the relative state of safety in 187 countries. Based on societal drivers and outcomes related to unintentional injury, the UL Safety Index measures the contributions of national resources and institutions, safety systems and frameworks, and safety outcomes.
The UL Safety Index can be used to support efforts by governments, safety professionals, policymakers, the private sector, and non-governmental organizations to understand and prioritize actions to improve safety around the world. Since the inaugural study launched in 2016, academic leaders and practitioners in safety have provided input, resulting in improvements to the algorithm, a new indicator, and updated data.
These contributions help drive a more comprehensive dialogue about safety issues. Additionally, working with policymakers, advocates and stakeholders, we can better identify priorities for investments in programs and policies to improve safety.
Each of the 187 countries studied receives an overall Safety Index assessment between 0 - 100. The Index assesses countries on three measurable drivers of safety: Institutions and Resources; Safety Framework; and Safety Outcomes.

Table 3: UL Safety Index Structure
Note: The UL Safety Index does not measure intentional injury in relation to crime, terrorism, war, and suicide. Refer to Table 3 for Key Drivers and Indicators used in the Index.
The UL Safety Index is computed as the geometric mean of the three key drivers of safety -- Institutions & Resources, Safety Frameworks, and Safety Outcomes. The following equation illustrates the relationship between these Drivers:
How did Southeast Asian countries score in 2017?
The 11 countries of Southeast Asia can be divided into three groups, based on the Index values and scores:
- High (80 - 100): Singapore
- Mid (50 -79): Malaysia, the Philippines, Thailand, Vietnam, Indonesia, and Brunei
- Low (below 50): Cambodia, Timor-Leste, Myanmar, and Laos.
Countries that achieved mid to high scores are significantly safer than others in the region and have made significant development progress in the last few decades through economic and government reforms. Laos, Myanmar, Timor-Leste, and Cambodia all have below average scores for GDP per capita, Education, and Government Effectiveness. These remain challenges in these countries.
Key indicators “Government Effectiveness” and “Technology” crucial to safety
Singapore ranked as the 12th safest country in the global Index. The country has the highest GDP per capita in the region. Its global ranking puts the nation on par with Ireland, and ahead of countries such as Israel, Finland, Germany, USA, Austria, France and Japan.
Compared to the top five countries in the Index -- the Netherlands, Norway, Australia, Sweden, and Canada -- Singapore scores lower for Education (83). The Top 5 countries all had strong scores for Education (89 – 100). Figure 4: UL Safety Drivers: Singapore versus Top 5 Countries
The top five countries and Singapore all achieved the maximum score (100) in the ‘Codes and Standards’ indicator, demonstrating high levels of participation and engagement in national, regional and global codes and standards development. Building and life safety, fire, and electrical codes are adopted at the national or state level. There were two indicators in which Singapore scored full points (100), but none of the top five countries did, Government Effectiveness and Technology.
The importance of Government in driving safety
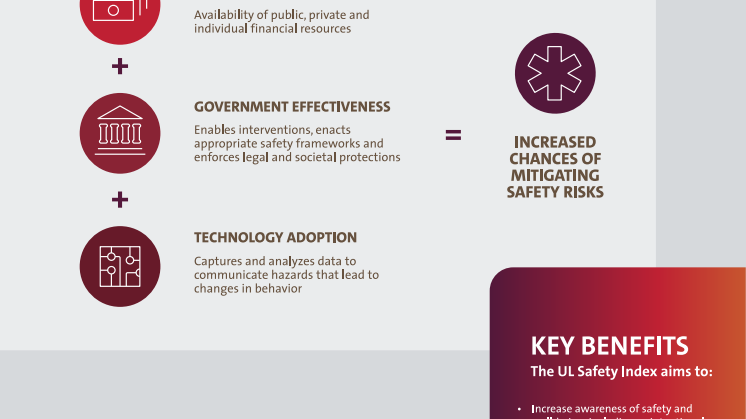
Governments can play a significant role in reducing unintentional injuries. Laws, Regulations and Standards all help to codify societal norms for risk and safety. A government’s effectiveness in promoting safety is correlated to its ability to recognize the need for intervention, enacting appropriate safety frameworks, and enforcing legal and other societal protections.
The use of technology to capture and analyze data, identify and communicate hazards, and assess the effectiveness of safety improvement efforts is also influential in increasing general awareness of safety hazards and changing. Government intervention, coupled with the use of technology to identify and mitigate risks, is an effective strategy to create a safe environment.
While the top 10 countries hold values ranging between 91 and 98 for their respective Safety Framework driver scores, Singapore is at 83. However, with Singapore’s strong performance in Government Effectiveness and Technology, the country still offers a safe environment, indicated by its 12th position in the Global Ranking.
Meanwhile, neighboring countries such as Malaysia, the Philippines, Thailand and Indonesia have also demonstrated participation, engagement, and adoption of global codes and standards activities at the same level as Singapore. However, these countries ranked far lower than Singapore. Among other factors, the lack of Government Effectiveness and use of Technology (with scores between 45 to 72) indicate that these countries have not been as effective at creating a safe environment.
Wealth of Nation, Not Country Size, Key to Safety
The data in the Index shows that the size of the country does not necessarily matter then it comes tosafety performance. Singapore and Laos have a similar size population, yet Singapore’s ranks 12th globally, while Laos ranks 169th.
The wealth of a nation (measured by GDP per capita) has a significant impact on safety. There is a correlation between GDP per capita and a country’s Safety Index value. Compare Singapore, with the highest GDP per capita in Southeast Asia at USD53.5 million and an index score of 91 with Laos which has aGDP per capita of USD6.6 million and an index score of 39.
Does Wealth Lead to Better Safety Outcomes?
While the population of many industrialized countries begins to age, Southeast Asia’s population is predicted to grow faster than the global average. The region boasts some of the world’s fastest growing economies with Vietnam and Philippines growing by 6 percent a year.[2] According to the World Economic Forum, the region is set to become the world’s fifth largest economy with a combined population of 620 million and an economy of $2.6 trillion. GDP per capita is also set to increase over the next 20 years.[3]
It is fair to assume that countries that have achieved economic success and can sustain economic growth over time can improve their living standards. Rising GDP provides developing economies with more resources to build and improve infrastructure, implement public health programs and provide better education.
However, the government’s approach to solving societal problems can negate or change the safety or well-being dynamic.
In the 2017 OECD study, “How’s Life?”, the Nordic countries of Norway, Sweden and Finland were ranked as the top three countries for the well-being of their citizens. This is despite the fact that Norway did not rank highly for household net wealth. The study examined if and how material conditions (income and wealth, jobs and earnings, and housing) and quality of life (work-life balance, health, education, personal safety and environmental quality) affected well-being. While the U.S. (placed 20 in global ranking with a GDP per capita of USD56,207)has one of the highest GDP per capita in the world, the
country has not demonstrated to a long term, consistent approach to infrastructure development. Its complicated system of state and federal funding of safety-related programs impacts investments and programmatic inventions. The private sector is expected to solve many of the problems that are addressed by the government in other countries.
Beyond Safety to Quality of Life
When we examine Southeast Asia’s Safety Outcome scores and key indicators, not one country has been able to address unintentional injury uniformly. Some – including Singapore, Malaysia, and the Philippines - have a better track record than others. However, even with almost perfect scores across the various indicators, Singapore performs the lowest in outcomes related to falls, as compared to Malaysia,the Philippines. Thailand and Indonesia -- why is that the case?
Why is it that some countries have better safety outcomes in some areas but not in others? The intention of the Safety Index is to create a dialogue that support efforts by governments, policymakers, and other stakeholders in order to prioritize actions and improve safety in each country. Answers to this question requires detailed and nuance understanding of the people, culture and environment in each country. And for these reasons, we continue to partner with local governments and stakeholders to conduct the detailed research that will provide actionable answers.
While the 2017 Index only addresses unintentional injury, safety is much broader than this. As we continue to expand the scope of the UL Safety Index, our vision is to incorporate additional dimensions of safety including security, sustainability, chronic disease and intentional injury. Through this, the Index will offer a wider measure of safety around the world.
While the OECD “How’s Life?” Study equates one of the indicators - Safety to Personal Safety, it does not in corporate unintentional injury, which is a vital part of the equation. Other factors - such as resources, education, and political will – have clearly demonstrated that they positively impact on safety outcomes too.
All of these seemingly conflicting facets of the analysis reinforce the fundamental concept that is at the heart of the UL Safety Index and our work.That concept is that safety is a system, and this means that no one element, wealth, education or codes and standards (for example) are sufficient to ensure safety.At UL, we believe that when a system of safety measures are put in place and implemented, our quality of life improves.
Click here to find out more about how your country and others performed in our 2017 UL Safety Index.
Note: Because the UL Safety Index makes use of publicly available, validated and trusted indicators from multiple sources, values for each indicator were not available for every country. Given these limitations, the quantification of the state of safety for some countries may be less accurate than others. While the Index for a given country may be higher or lower if additional data were available, our methodology helps to ensure that countries are not penalized for the lack of specific data.
________________________________________________________________________________________
[1]Global Burden of Disease Collaborative Network. Global Burden of Disease Study 2016 (GBD 2016) Results. Seattle, United States: Institute for Health Metrics and Evaluation (IHME), 2017. Available from http://ghdx.healthdata.org/gbd-results-tool.
[2] Cheok, M. 2017, August 7. Fifty Years On, Southeast Asia Emerges as Global Growth Leader. Bloomberg. Retrieved from: https://www.bloomberg.com/news/articles/2017-08-06/fifty-years-on-southeast-asia-emerges-as-global-growth-leader
[3] Shawb, K.. Sala-i-Martin, X. 2014. Global Competitiveness Report, 2014 –2015. World Economic Forum. Retrieved from: http://www3.weforum.org/docs/WEF_GlobalCompetitivenessReport_2014-15.pdf
Related links
Topics
- Public sector
Categories
- ul safety index
- safety
- southeast asia
- safety standards