Blog post -
New year, new service: The checkup for your website
Imagine you're making a visit to the doctor to check your blood pressure, cholesterol, etc. The resulting values indicate how healthy you are by comparing them to existing values, such as those from your last checkup. You can conclude that they are relatively high or low in general, and assess if they've increased or decreased compared to your last checkup. By tracking these values over time you can create a plan to improve your health.
A Quantitative Usability Study is very much like that. We check different dimensions of the user experience (UX) of your product, for example how many users successfully performed a task, how much time it took, the user's subjective rating of their immersion with the product, or its perceived aesthetics. The resulting values indicate how good the UX is by comparing it to existing values like industry benchmarks or your previous iteration. You can conclude that the UX is relatively high or low in general, or that it increased or decreased compared to the last iteration. By tracking the UX over time you can create a plan to improve your UX.
The diagnostic nature of this type of study indicates potential improvements and offers a means to prioritize which features/areas require further investigation.
Getting the best of both worlds: Task- and study-level metrics
Researchers have already paved the way and created frameworks to measure the UX of interactive products. They made sure to standardize the questions using a scientific approach and validate the results with statistical methods instead of using ad hoc questions. This has several advantages, such as users responding similarly when evaluating the same interface, or being able to distinguish between products with good and bad UX. There are many frameworks to pick from depending on your goals and internal procedures. If you're only interested in measuring the overall usability of your product - meaning only task-related metrics - the SUS (System Usability Scale) is the most widely used standardized questionnaire. It provides 10 rating questions, which are combined into a final score assessing the usability of your product. Similarly, the UEQ (User Experience Questionnaire) is a questionnaire to assess the UX (non-task-related metrics) and usability using adjectives in a semantic differential, to measure certain dimensions of the UX like attractiveness, stimulation, and novelty, as well as task-related metrics like efficiency, perspicuity, and dependability.
These questionnaires assess the overall usability/UX of your product. In order to know which tasks are the most problematic, different metrics are used and administered right after the user finishes the respective task. One of the most meaningful metrics is the task success rate. Knowing how many users were able to successfully perform the task at hand indicates which tasks need improved usability to make users not feel frustrated. Other metrics are for example efficiency (amount of time needed to complete a task or alternatively the subjective opinion if a task took long or short to perform) and difficulty.
Having both task- and study-level metrics ensure that you get a holistic understanding of your product's UX.
Knowing when to conduct a Quantitative Usability Study
There are many scenarios where this study is the right choice. For example, if you don't have any concrete numbers to confidently know the state of your product's UX, or your analytics show you that users seem to struggle, but you're not sure where. Are users actually able to perform core tasks with ease? Is UX the reason why users prefer your competitors? Is the state of your prototype good enough (e.g. does it meet the requirements of your internal benchmarks) to move on to the next iteration? Which of several designs provides the better UX?
Keep in mind that this type of study will give you numbers, which indicate where potential problems are but do not provide feedback as to ‘why’ they exist. It is highly recommended to follow up with a qualitative approach to dig deeper into why users were struggling with specific tasks or why they rated your UX differently than you expected.
Outlining a case study
Let's pretend you're in charge of the UX of a website for booking flights. To find out how good the UX actually is and how it compares to your two biggest competitors you decide to run a Quantitative Usability Study with 50 users performing core tasks with each of the three websites in reverse order. You are mainly interested in the task success rate of booking a last minute flight and get the following results:
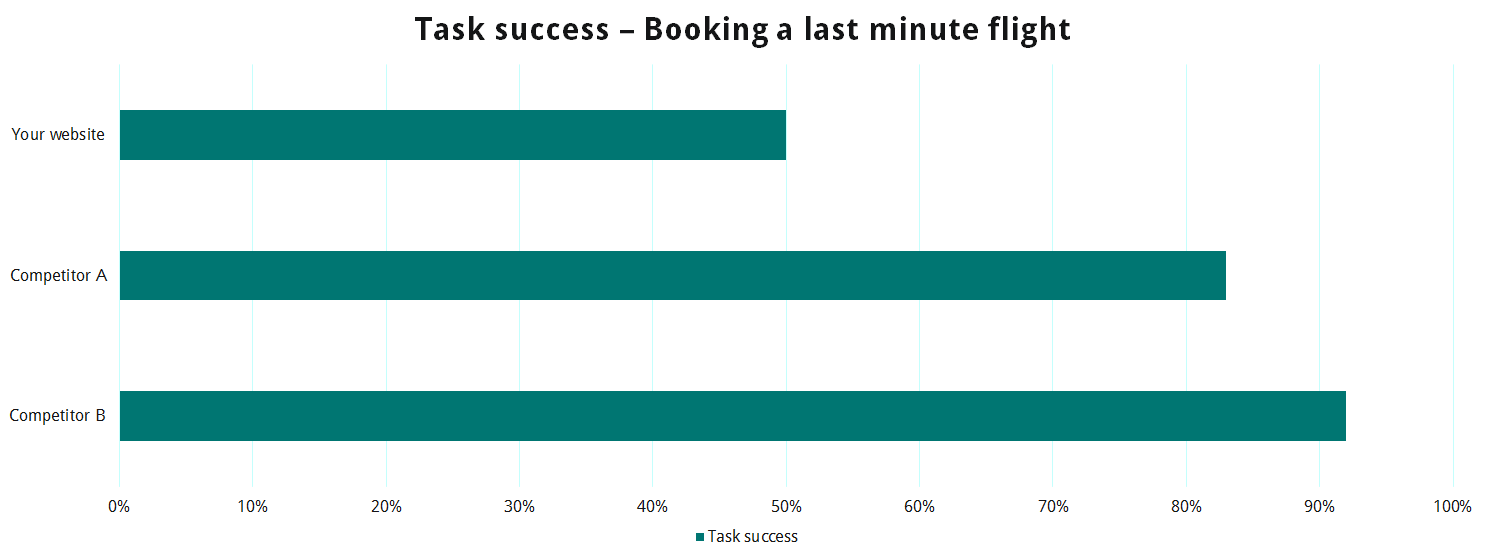
With these results you can confidently report that your website has a lower task success rate for booking a last minute flight than your competitors. Metrics shine extra bright when you're able to set them in context to other numbers, such as those of your competitors. With this outcome you can now concentrate on this task (assuming the success rate of other tasks weren't worse), and follow up with a qualitative-based study to find out why half of your users were unable to book a last minute flight. You would then be able to fix the reported issue and, again, measure the task success rate against the competition to find out if these changes were fruitful.
Are you in need of numbers?
To understand the state of your product's UX, Testbirds provides Quantitative Usability Testing for your interactive products. Contact us now.
Related links
Topics
- Working life