Blog post —
Instagram Insights: 5 most essential metrics for social media managers
With over 1 billion monthly users, Instagram is the most important social media platform for marketing besides Facebook. These are five of the most important metrics every social media marketer should know.
Engagement is the whole purpose of social media, no matter if its Twitter, Instagram, Snapchat or Facebook. And while getting your audience to interact with your brand can be a challenging task, with a good analytics tool, you can the insights you need to strengthen your social community and increase engagement.
The more people that comment and interact with your posts, the more people you will reach organically, in general. Tracking engagement is never wrong, and engagement related KPIs should always be at the core of your strategy.
But there are many other metrics than just engagement rate (ER) that you need to understand fully to really leverage the Instagram trend.
Get started with Instagram Insights
In order to get access to Instagram Insights and be able to view your metrics and analytics you need to first switch your account to an Instagram business profile.
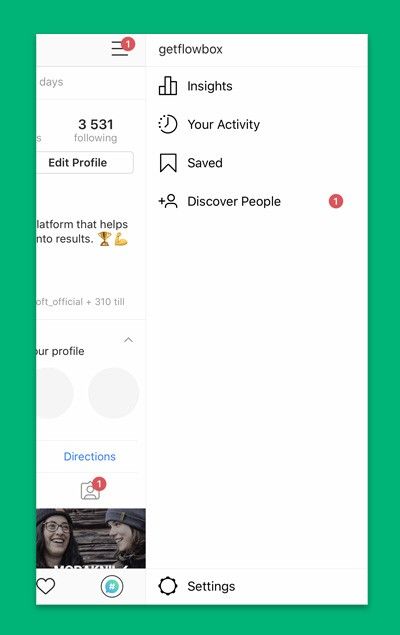
- Click on your profile at the bottom right corner of the home screen.

- Click the hamburger menu icon on your right hand side of the screen (the three horizontal lines). At the top of the menu that appears, click Insights.
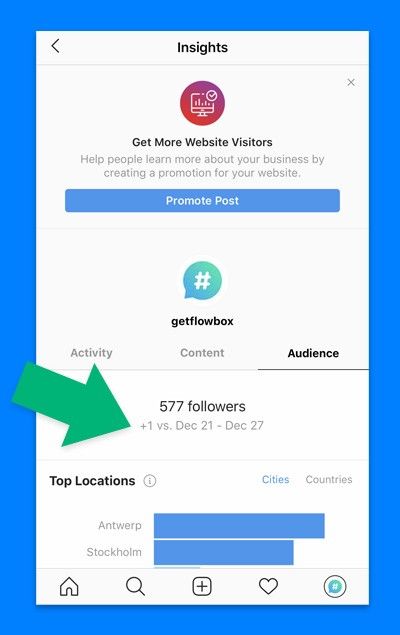
- There are three sections in Instagram Insights as shown in the picture below. Activity, Content and Audience. Activity is divided into two subsections, Interactions and Discovery. Interactions are how many profile visits you’ve had during the last seven days and how many people have clicked the website link, if you added one, in your Instagram biography.
In the Discovery subsection further down, you will see the total reach and impressions.
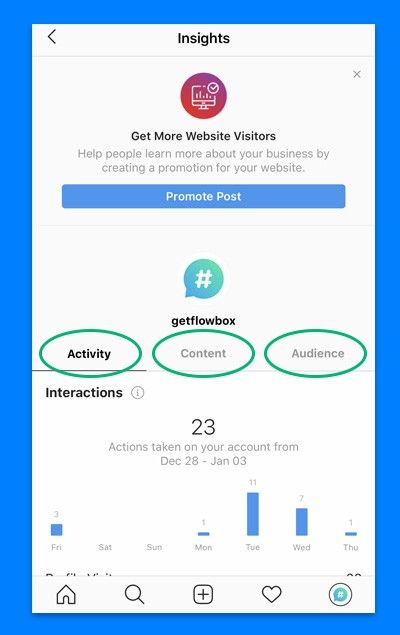
Then there is the Content tab and the Audience tab. In the Content tab you can get more in-depth information about how your regular feed posts and stories have performed. The Audience tab includes data about your followers. It shows how many followers you have and whether you’ve gained or lost followers since the previous week, age and gender of your followers as well as when they are active on Instagram.
These three main sections, Activity, Content and Audience, will be explained more in detail further down in this article.
- The next step is to choose which metrics and KPIs that you want to track. Having too many KPIs is often not recommended, however, by focusing on for example only impressions or link clicks and not engagement or vice versa, you run the risk of missing important aspects of your strategy.
Reach and impressions
So first, let’s break it down. What is actually the difference between reach and impressions? Here is how Instagram defines these both terms:
Reach: The number of unique accounts that have seen any of your posts.
Impression: The total number of times all of your posts have been seen.
Impressions and reach are sometimes wrongly used synonymously. Whereas reach refers to unique views, impressions are the total number of views on your content. In other words, impressions are counted each time a user sees your content.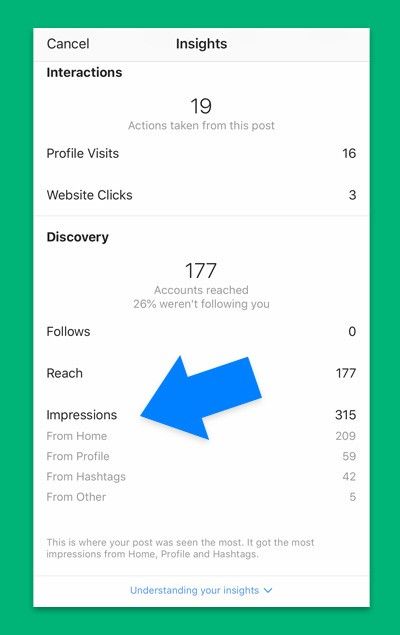
This means that if someone scrolls past your post in their Instagram main feed and repeats this action several times, it will count as several impressions. This metric doesn’t take into consideration if the user engaged in the content. An impression simply means that the content appears in someone’s feed, no matter if the user clicked, liked or commented on the post.
A higher number of impressions than reach is an indicator that your audience is viewing your content multiple times.
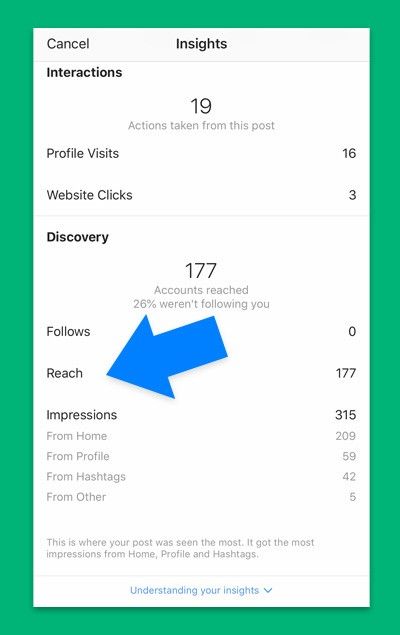
Reach on the other hand is the number of unique accounts that have seen your post. If someone views your posts several times from one single account, it will only count once.
However, reach and impressions should not be your only metrics. They are important to know whether your content has an impact on your audience but they don’t measure the quality of the content.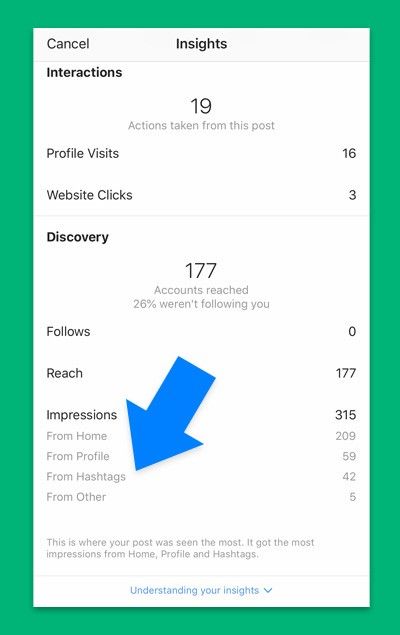
Instead, your focus should be what accounts you reach and where those impressions come from. If you are using hashtags, you will also reach not only your existing followers but also accounts that aren’t following you.
This data is available on Instagram Insights under the Content tab. Open one of your posts and click View Insights under the image. Swipe up the analytics section that appears at the bottom so that it fills your entire screen. Under the Discover section you can see how many impressions that stem from for example hashtags and other relevant data.
Engagement rate
Engagement rate is probably the most essential metric for social media marketers. Reach and impressions are quantity metrics and tell you how big impact your is and whether you are likely to succeed in creating awareness.
If you manage to reach a wide audience it can mean your content is of good quality, but it can also mean that you just posted it on the right time. When you also measure how your audience reacts when they see your content, you can get an indicator of the quality of your content.
On Instagram, engaging in a post means that someone has liked the post, commented on it or saved it. The engagement rate (ER) in social media is most commonly calculated as the engagement for a post divided by the total reach of that post. For a single Instagram post the equation would be:

Post engagement rate = Post engagement / Post reach.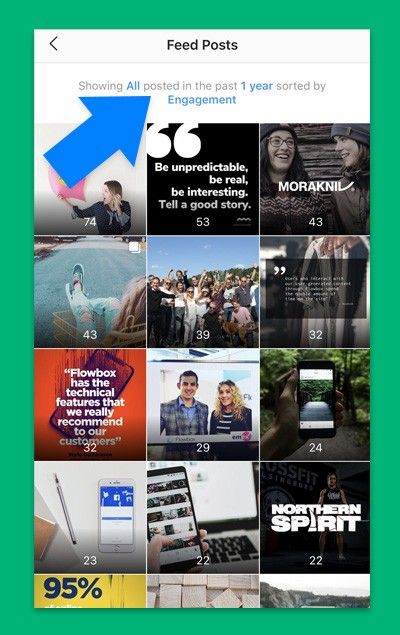
Instagram Insights doesn’t show ER but you can see the number of engagements per post as well as the reach per post, so calculating it manually is quick and easy. Go to Instagram Insights and click the Content tab. Under posts, click “view all”. Filter the content according to your needs by clicking on the short description at the top of the feed, where it in the picture above says “Showing All posted in the past 1 year sorted by Engagement”.
You can then filter based on content type, metric and time range. Filter out the content as shown in the picture above so that you can first see engagement, then reach. Click “apply”. The feed will filter your content and show the data you requested for each post.
Calculate the ER manually or in a spreadsheet if you don’t have a social media tool that can provide you with this data automatically.
If one of your Instagram images for example has 40 engagements and reached 500 accounts, the equation would be: 40/500 x 100 = 8% ER for the same specific post.
You can also calculate an average ER for all of your previous posts and use it as a benchmark for your future Instagram strategy and when posting new content. Or compare the ER from week to week and see if it’s constantly decreasing, increasing or if it stays on the same level over for example a year.
Link clicks
While engagement is often the main purpose of all social media activities in general, of course you also want to drive traffic to your website or landing page.
On Instagram you can do this by adding a link in the biography section. It doesn’t have to be your main website, you can change this link as often as you like. The link will appear at the bottom of your biography so to hype it up and make it extra inviting, make sure that you have a good call to action and that the description right above the actual URL leads naturally to the link itself. Otherwise, people who are visiting your profile might not notice it.
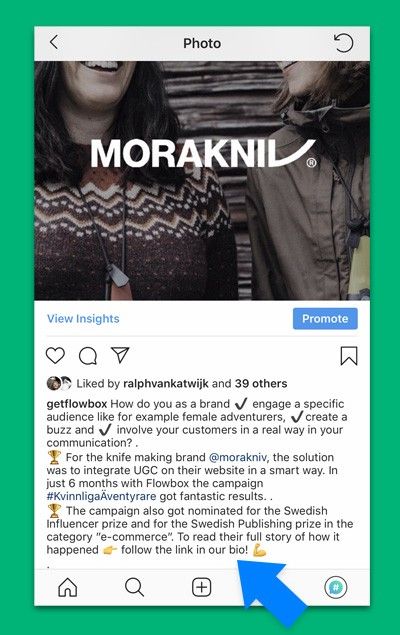
To drive traffic to the link, you can write a short call to action in the caption of your posts where you encourage your followers to click it.
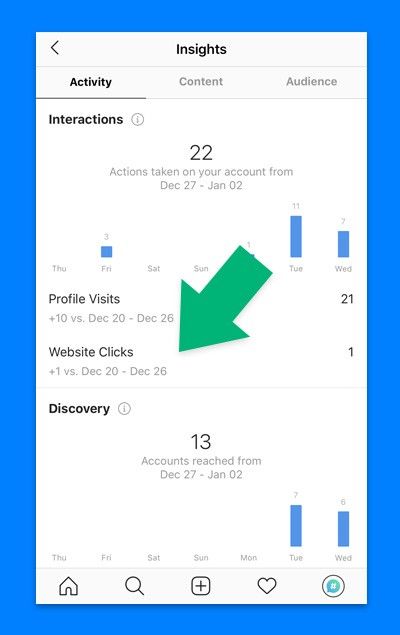
To find out how well your call to action (CTA) is performing, go to Instagram Insights. Under the Activity tab you can see the number of link clicks under the title Website Clicks.
Follower growth
Whether you lose or gain a follower every other day or so doesn’t really matter and doesn’t necessarily mean that you are posting bad content. Instead, what you should be looking at is whether your growth is increasing or decreasing over time or from month to month.
Follower count alone doesn’t give you any information as to how fast or slow your following is growing from month to month. Of course, as long as your following is constantly growing you are on the right track.
But most social media managers will at some point want to track the growth over time and more in-depth. Instagram Insights is rather limited in this aspect, but you can calculate this manually in a spreadsheet where you record how many followers you have for example every week and then compare percent change every month.
If a follower unfollows you it could just mean they are practicing the follow-unfollow method (to follow a number of accounts and unfollow after they follow back) or that it’s a spam account that’s been closed.
But if you are losing followers over a longer period of time or if your growth rate is slowing down from month to month and goes from for example 6% in September, 4% in October and 1% in November, it’s a strong signal you need to you change your content strategy.
This is why tracking follower growth is more important than just follower count. By just counting the number of followers you wouldn’t know that your content strategy needs to be changed due to declining follower growth in the above example.
Your followers and when they are online
Knowing your audience and having a target persona is marketing basics. Under the Audience tab in Instagram Insights you can get basic information about your followers, such as where they are located, age range and gender.
If and how you choose to use this information in your strategy is up to you. There are cases when this data is not relevant for your strategy, for example if you are a B2B business in a certain industry or if your marketing simple isn’t based on these factors.
However, when your followers are active and online is something that will be relevant no matter what industry you’re in. Posting on a day and hour when your followers are typically online on Instagram will of course increase your impact.
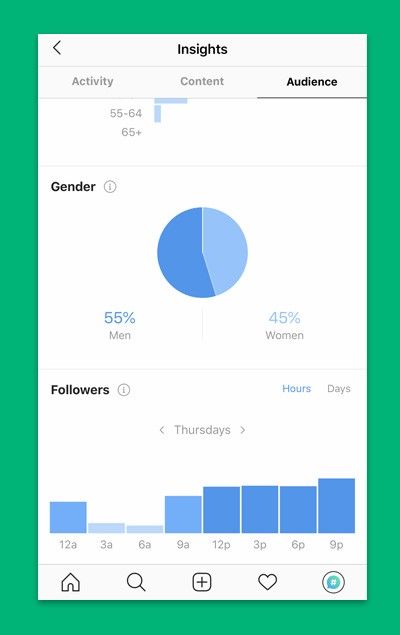
Scroll down to the bottom of the Audience tab. In the Followers section you can see when your followers are on Instagram on different days of the week, as well as what days of the week they are most active.
Next step
Now you know what the most essential metrics are in Instagram Insights. No matter which ones you choose as your KPIs, knowing your data is crucial to create a strategy that is built on insights and knowledge.
There are many other metrics than the ones described in this article, but they will in most cases require a third-party analytics tool that can do the math for you.
Using Instagram’s built-in analytics tool is free if you have a business account and with Instagram Insights you will get the most basic data that you need to improve your content strategy.
By focusing on increasing engagement and using engagement related metrics to measure the success of your efforts, you will build a brand that is focused on your audience and customers. This will start conversations and inspire your followers to create user-generated content that you can use in your marketing strategy to save both time and money.
Topics
- Awards
Categories
- social media
- tips & tricks