Ämnen: Företagande
-
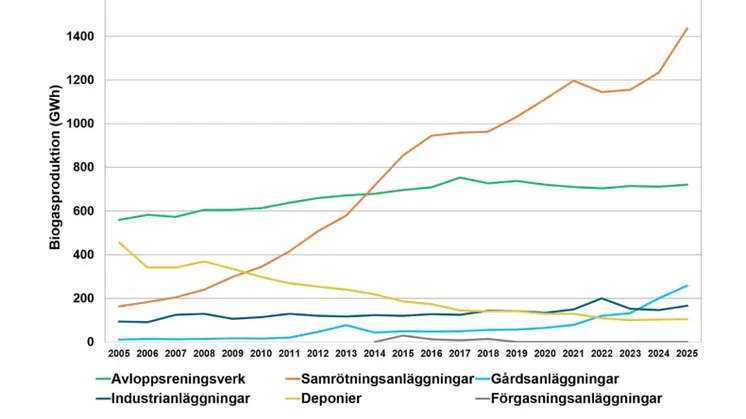
Figur 4 Produktion av biogas och biometan GWh i Sverige per anläggningstyp år 2005–2025
- Licens:
- Medieanvändning
- Filformat:
- .jpg
- Upphovsrätt:
- Energigas Sverige
- Storlek:
- 3160 x 2097, 502 KB
-
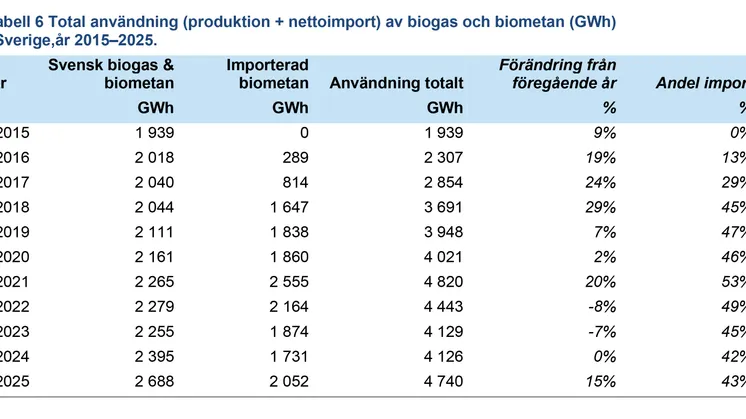
Tabell 6 Total användning produktion och nettoimport av biogas och biometan 2015–2025
- Licens:
- Medieanvändning
- Filformat:
- .jpg
- Upphovsrätt:
- Energigas Sverige
- Storlek:
- 3229 x 1553, 430 KB
-
Tabell 5 Total användning av flytande biometan GWh i Sverige år 2020–2025.jpg
- Licens:
- Medieanvändning
- Filformat:
- .jpg
- Upphovsrätt:
- Energigas Sverige
- Storlek:
- 2556 x 1062, 256 KB
-
Tabell 4 produktion av flytande biometan GWh och antal anläggningar år 2012-2025.jpg
- Licens:
- Medieanvändning
- Filformat:
- .jpg
- Upphovsrätt:
- Energigas Sverige
- Storlek:
- 3100 x 1727, 315 KB
-
Tabell 3 Användning av biogas (GWh) producerad vid svenska biogasanläggningar uppdelat på användningsområde år 2025.jpg
- Licens:
- Medieanvändning
- Filformat:
- .jpg
- Upphovsrätt:
- Energigas Sverige
- Storlek:
- 3092 x 1445, 434 KB