Press release -
Singapore comes in first in Asia Pacific in PwC Cities of Opportunity Index and second globally
| Date | 7 September 2016 |
Contact | Natalie Choo Tel: +65 6236 4309 Mobile: +65 9738 1415 E-mail: natalie.yl.choo@sg.pwc.com |
Study assesses social and economic health of 30 leading cities
- Singapore emerges top in three of the 10 indicators
- European cities – London, Paris, Amsterdam – make a strong showing in biennial PwC study
- Economic clout, ease of doing business, education, technology readiness, location and access, amongst key measures
- London performance underlines strengths and potential areas for competition post Brexit
- City risk resilience and tax profiles assessed
Wednesday 7 September 2016 –Singapore continues its rise as number two among the 30 leading business centres globally studied by PwC in the 2016 edition of its Cities of Opportunity report. It was ranked seventh in 2012 and third in the 2014 edition. Singapore maintained its position as number one Asian city and is the only Asian country to emerge in the top five. It ranks first in three indicators – transport and infrastructure, technology readiness and ease of doing business.
The report provides a balanced benchmarking of the social and economic health of 30 of the world’s leading business cities. It measures their performance against 10 indicators including transportation and infrastructure, ease of doing business, demographics and liveability, technology readiness and cost.
The city-state repeats its top ranking from the previous Cities of Opportunity study for the quality of its transport and infrastructure and ease of doing business. This is the third consecutive edition where Singapore has emerged top in ease of doing business. Despite not being first in any of the variables, it comes in second in five of the eight variables.
Notably, Singapore has risen seven places in technology readiness rising from eight place from the previous report to first in this edition. Although the country only tops one of the variables (mobile broadband speed), it fairs consistently well in all variables within the indicator.
Yeoh Oon Jin, Executive Chairman at PwC Singapore comments:
“Singapore’s performance is a testament to the success of planned development driven by the government to make the country a truly global city. We look forward to the continued strengthening of Singapore’s position through initiatives such as the Committee of Future Economy, SkillsFuture and Smart Nation push.
“Singapore is well-positioned to be the leading global city. As a regional financial and trading hub, Singapore thrives not just on economic growth alone, but on its relentless drive to push for a forward-looking, inclusive and vibrant ecosystem that supports both businesses and community needs. The partnership between government, businesses and its citizens will be key for Singapore to further enhance her economic and social standing, even in challenging times.”
London comes in pole position in PwC’s Cities of Opportunity Index; Toronto third, with Paris and Amsterdam completing the top five. Overall, European cities take four of the top ten places.
Cities of Opportunity’s comprehensive measurement of major centres of business, commerce, intellectual capital and culture, highlights the complex economic and policy challenges cities face to succeed.
- London retains the first position for the second edition in a row, and extends its lead against close rivals in the study. The city is among the top three in six indicators covered by the study, including intellectual capital and innovation; technology readiness; city gateway; demographics and liveability; economic clout; and ease of doing business. Any effects Brexit may have on London will take place in a process that will evolve over time and not overnight. Questions include the effects on talent mobility and migration, trade, investment and regulation, among others.
- Singapore, the city-state renowned for its planned development, comes in second – up from third position in 2014. In addition to ranking #1 in three indicators – technology readiness, transportation and infrastructure and the ease of doing business – the city performs well in the area of tax. An analysis of corporate total tax rate, personal rate, and tax efficiency shows that Singapore, along with Dubai and Hong Kong, have the lowest rates and highest efficiency collectively.
- Toronto, third in the study, ranks in the top 10 in seven of 10 indicators, and does particularly well in categories that speak to the daily needs and concerns of urban residents – finishing second in health, safety and security; second in cost; and third in sustainability and the natural environment (tied with Seoul).
- Paris rises to fourth position overall from sixth in 2014 despite a decade of economic pressure and more recently, terror attacks. Paris performed strongly across the measures, the only city to make the top 10 in 9 out of 10 indicators. It returns to first in demographics and liveability overall, tying New York. Paris also bounces back to 2nd as a city gateway after falling to 7th in 2014.
- Amsterdam enters the study for the first time this year – in fifth position. The city finished in the top five in three indicators (intellectual capital and innovation; technology readiness; and sustainability and the natural environment). It also finished in the top 10 in a further four indicators (city gateway; health safety and security; demographics and liveability; and economic clout), challenging the traditional urban powerhouses.
- At #6, New York remains part of a global urban elite – but drops from second position in 2014 and first-place rankings in the editions before that. The city scores lower in many of this year’s newly-introduced measures and is overtaken by other cities’ gains in existing variables. It needs to improve substantially in sustainability and the natural environment, and health, safety and security (both #16) as well as cost (#25). On the upside, the city finished #1 (tied with Paris) in demographics and liveability, #2 in economic clout, and #3 in technology readiness (tied with Amsterdam).
- Stockholm,seventh, performs particularly well in the area of sustainability and the natural environment (#1 tied with Sydney) and transportation and infrastructure (#3). In addition, the city outscores all others in two new variables, senior wellbeing and water-related business risk.
- Beijing, which retains its overall#19 spot,performs particularly well in two study indicators: city gateway (#3) and economic clout (#3).
- Eight different cities finish first in at least one indicator. One of them – Johannesburg – tops all cities in competitiveness on cost, but isn’t in the overall top 10.
- While the need for risk resilience is not new, the stakes of disaster have skyrocketed with cities facing increasing risk from extreme weather, terrorism, nuclear mishaps and other manmade threats, as well as disease. This year’s study shows that the most vulnerable cities can also be the most resilient. Tokyo came top in exposure to risk and in their ability to deal with it – outperforming all other cities in natural disaster preparedness. Amsterdam has the second highest disaster vulnerability but the fifth highest preparedness.
- Because no two cities are the same, the study suggests each city needs to develop its own individual strategy to understand strengths, weaknesses, and identities and then orchestrate growth to suit its own profile, building on opportunities and also tackling challenges like providing affordable housing, knitting together effective public transit and reducing disaster exposure.
ENDS
Notes to editors
i.The complete ranking and a copy of the full report are available at http://www.pwc.com/cities.
ii.Singapore cut of the Cities of Opportunity 7 report is available at http://pwc.com/sg/en/government-public-services/cities-of-opportunity.
Methodology
1.PwC’s Cities of Opportunity 7 report measures 30 cities across 10 indicators including transportation and infrastructure, the ease of doing business, demographics and liveability, technology readiness and cost. In addition to the overall ranking, the study also ranks cities against each of the 10 indicators.
2.Brexit and London scoring. London’s performance, as that of all our 30 cities, is based on a methodology assessing data mostly from 2014-2015, and as a result the recent UK referendum vote to leave the EU (June 2016) does not affect the Cities of Opportunity data and report. Future editions will try to gauge the short-and medium-term impact of the vote to leave the EU, if any. But right now, the city remains the most global in the UK, and a major financial center with a rich foundation of human capital and flexible tradition to build on.
3.In order to make each of our 10 indicators ever more accurate and representative, we’ve increased our variables from 59 in our last report to 67 in this one and, in the process, added 15 entirely new variables while deleting or modifying another 12. Amsterdam, Bogotá, and Lagos enter the study for the first time this year. As a result, direct edition versus edition comparisons for all results is not possible.
4.Cities of Opportunity 7 is based on publicly available data, using three main sources: global multilateral development organisations such as the World Bank and the International Monetary Fund; national statistics organisations, such as National Statistics in the UK and the Census Bureau in the US; and commercial data providers. The data was collected during the third and fourth quarters of 2015.
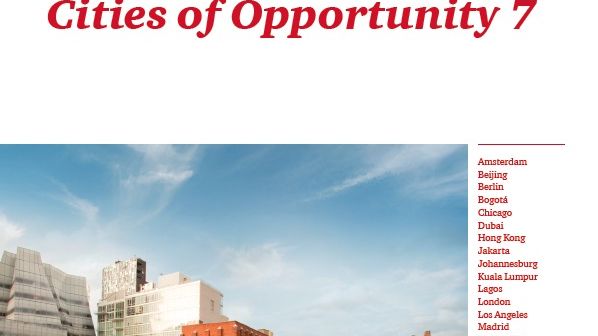
5.Cities included in the report are: Amsterdam, Beijing, Berlin, Bogotá, Chicago, Dubai, Hong Kong, Jakarta, Johannesburg, Kuala Lumpur, Lagos, London, Los Angeles, Madrid, Mexico City, Milan, Moscow, Mumbai, New York, Paris, Rio de Janeiro, San Francisco, São Paulo, Seoul, Shanghai, Singapore, Stockholm, Sydney, Tokyo and
6.The top three cities in each Cities of Opportunity indicator are:
- Intellectual capital and innovation: London, San Francisco, Paris
- Technology readiness: Singapore, London, Amsterdam and New York (tied for third)
- City gateway: London, Paris, Beijing
- Transportation and Infrastructure: Singapore, Dubai, Stockholm
- Health, safety and security: Tokyo, Toronto, Sydney
- Sustainability and the natural environment: Stockholm and Sydney (tied for first), Seoul and Toronto (tied for third)
- Demographics and liveability: New York and Paris (tied for first), London
- Economic clout: London, New York, Beijing
- Ease of doing business: Singapore, Hong Kong, London
- Cost: Johannesburg, Toronto, Los Angeles
Related links
Topics
Categories
About PwC
At PwC, our purpose is to build trust in society and solve important problems. We’re a network of firms in 157 countries with more than 208,000 people who are committed to delivering quality in assurance, advisory and tax services. Find out more and tell us what matters to you by visiting us at www.pwc.com.
PwC refers to the PwC network and/or one or more of its member firms, each of which is a separate legal entity. Please see www.pwc.com/structure for further details.
© 2016 PwC. All rights reserved