Image —
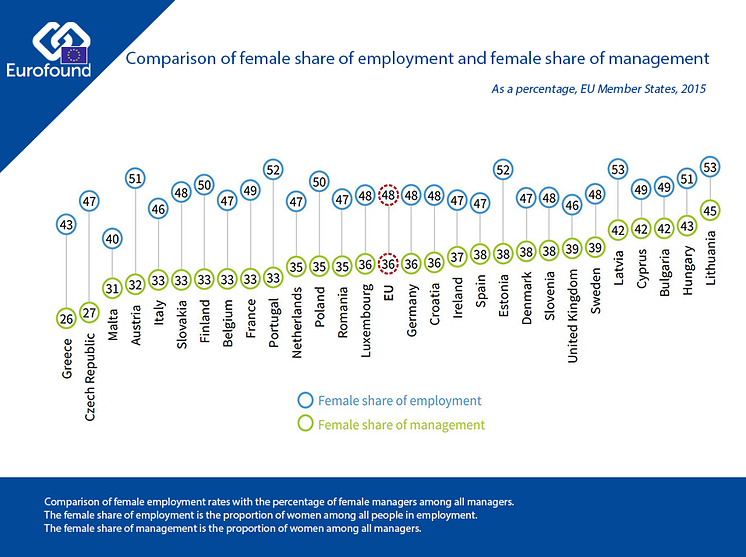
Female share of employment and management graph
go to media item
- License:
- Non-commercial use
The Content may be downloaded, used and shared with others, provided that the Content is unmodified, used as a whole and for a non-commercial purpose.The author or creator shall be attributed to the extent and in the manner required by good practice (this means e.g. that photographers must almost always be attributed).
- File format:
- .png
- Size:
- 957 x 714, 269 KB