Image —
Maps
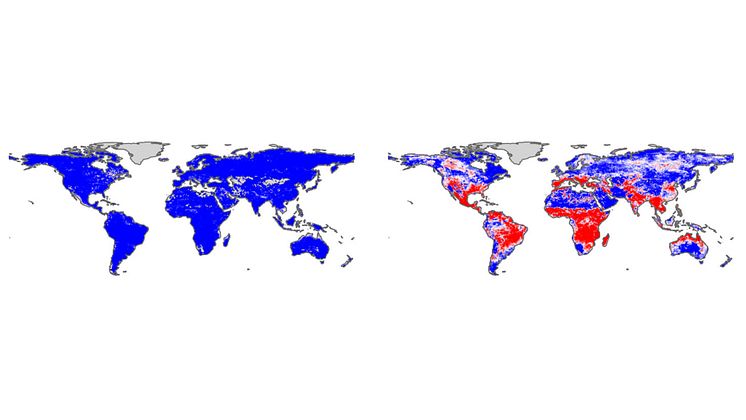
According to the study, more and more regions will be affected by multiple climate-related extreme events simultaneously. The blue colours show regions where isolated events are most common, the red ones show where co-occurring events are most common.
The left map shows present day, and the right map shows the future with medium-high emissions.
Gabriele Messori
- License:
- Media Use
The content may be downloaded by journalists, bloggers, columnists, creators of public opinion, etc. It can be used and shared in different media channels to convey, narrate, and comment on your press releases, posts, or information, provided that the content is unmodified. The author or creator shall be attributed to the extent and in the manner required by good practice (this means, for example, that photographers should be attributed).
- By:
- Gabriele Messori
- File format:
- .jpg
- Size:
- 1472 x 828, 125 KB